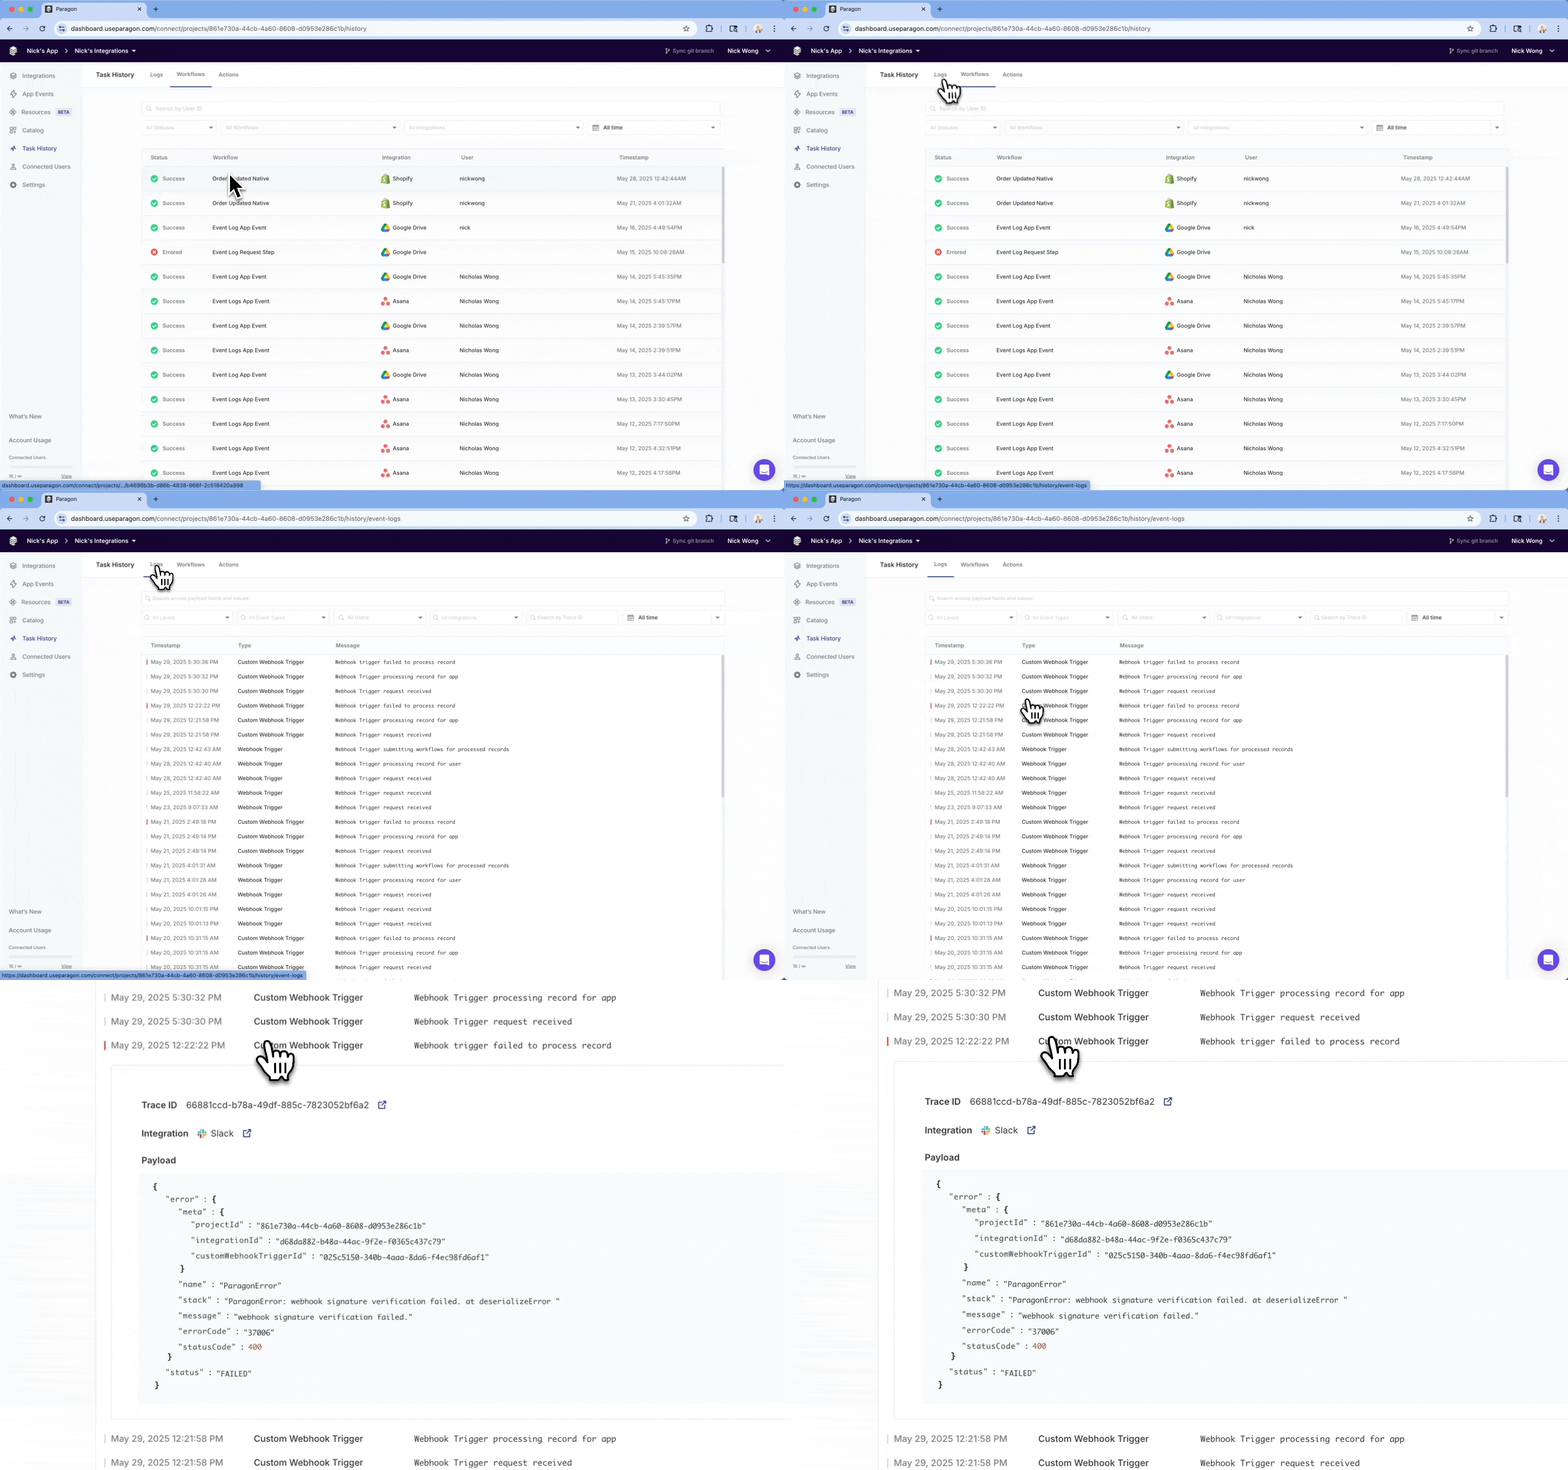
Event Logs allow you to search, view, and trace logs for all events that occur in your Paragon project. Event Logs contain relevant information that helps you build a complete picture of data moving from your app and your user’s integrations into your Paragon project. We are launching Event Logs beginning with a focus on workflow trigger events – including logs for Scheduler Triggers, Request Triggers, Custom Webhooks, and App Events. For example, if you’d like to see how an incoming webhook event from an integration was processed, you can filter by integration and trace the resulting workflow execution. You can find your project’s Event Logs by navigating to the Monitoring tab in the left sidebar and selecting the All Logs tab.Documentation Index
Fetch the complete documentation index at: https://docs.useparagon.com/llms.txt
Use this file to discover all available pages before exploring further.

- Timestamp: The date and time the event occurred.
- Type: The Paragon feature emitting the event.
- Message: The message associated with the event.
Log Details
By expanding a log, you can view the full event object including the payload, associated Trace IDs, User IDs, and more.| Property | Description |
|---|---|
projectId | Unique identifier for the Paragon project under which the trigger or workflow runs. |
personaId | ID representing the persona (or agent) responsible for executing the trigger. |
type | Indicating the type of trigger or event. |
endUserId | Identifier for the end user associated with the event or workflow. |
connectCredentialId | ID of the credential used to connect to an integration. |
connectCredentialConfigId | ID for the specific configuration of the credential in use. |
workflowId | Identifier for the workflow that is being triggered or executed. |
traceId 🔸 | Identifier used to group logs from the same trigger execution for traceability. |
integrationId 🔸 | ID of the integration involved, especially for integration or webhook triggers. |
webhookId 🔸 | Identifier for the webhook associated with a trigger (when applicable). |
eventId 🔸 | ID for the specific App Event received. |
eventName 🔸 | Name of the App Event being triggered. |
error 🔸 | Error object included in failure logs to describe the problem. |
status 🔸 | Indicates the result of the operation, such as EVENT_STATUS.SUCCEEDED or FAILED. |
Filtering and Searching
You can filter the Event Logs view using these filter dropdowns:- Level: The severity of the event.
- Type: The Paragon feature emitting the event.
- User ID: The Paragon user ID who triggered the event.
- Integration ID: The integration associated with the triggered event.
- Trace ID: The trace ID of the event.
- Timestamp: The date and time the event occurred.
Supported Events
Here are the following event types that can appear in your Event Logs:Platform
User Credentials
User Credentials
Credential refresh events are emitted when we attempt to refresh a user’s access tokens.
We have introduced credential refresh events for select integrations, and plan to expand support over time.
- Attempted to refresh credential
- Failed to refresh credential
- Successfully refreshed credential
Workflows
App Events
App Events
App Events logs are emitted when a workflow is triggered by the Paragon SDK. Learn more about App Events here.
- App Event Trigger Started
- App Event Trigger No workflows subscribed for trigger
- App Event Trigger Submitting workflows for execution
- App Event Trigger Workflows submitted successfully
- App Event Trigger Workflow submission failures
- Error preparing workflow for event trigger
- App Event Trigger No workflow configured with event eventName
Request Trigger
Request Trigger
Request Trigger events are emitted when a workflow is attempted to be triggered by an HTTP request sent to the Paragon Request Trigger. Learn more about Request Triggers here.
- Request Trigger Started
- Request Trigger workflow submitted for execution
- Request Trigger execution response timeout occurred
- Request Trigger Failed
Integration Enabled Trigger
Integration Enabled Trigger
Integration Enabled Trigger events are emitted when a user initially actives your integration. Learn more about Integration Enabled Triggers here.
- Integration Enabled Trigger Started
- Integration Enabled Trigger workflow submitted for execution
- Integration Enabled Trigger Failed
Scheduler Trigger
Scheduler Trigger
Scheduler Trigger events are emitted when a workflow is triggered according to a Scheduler Trigger’s cadence. Learn more about Scheduler Triggers here.
- Scheduler Trigger submitting workflow for execution
- Scheduler Trigger failed to submit execution for workflow
Webhook Trigger
Webhook Trigger
Webhook Trigger events are emitted when a workflow is triggered by an incoming integration webhook. Learn more about Webhook Triggers here.
- Webhook Trigger request received
- Webhook Trigger processing record for user
- Webhook Trigger submitting workflows for processed records
- Webhook Trigger processing record for app
- Webhook Trigger submitting workflows for app users
- Webhook trigger failed to process record
- Webhook Trigger processing record for resource
- Webhook Trigger Submitting workflow for resource
- Webhook trigger failed to process record for resource
- Webhook Trigger failed to process record
ActionKit
ActionKit
ActionKit
ActionKit events are emitted when an ActionKit request is made.
- Start
{ACTION_NAME} - Completed
{ACTION_NAME} - Failed
{ACTION_NAME}
Unsupported Events
The following events are not currently supported in Event Logs:- Task executions and their individual outbound API requests
- Requests made to or received by Resources
- Connected User events
- Managed Sync events
Connecting with Event Destinations
An integration with Event Destinations is coming soon.