Overview
The system can be divided into multiple components:- Network
- Kubernetes cluster
- Datastores
- Application microservices
- System monitors
- Bastion (optional)
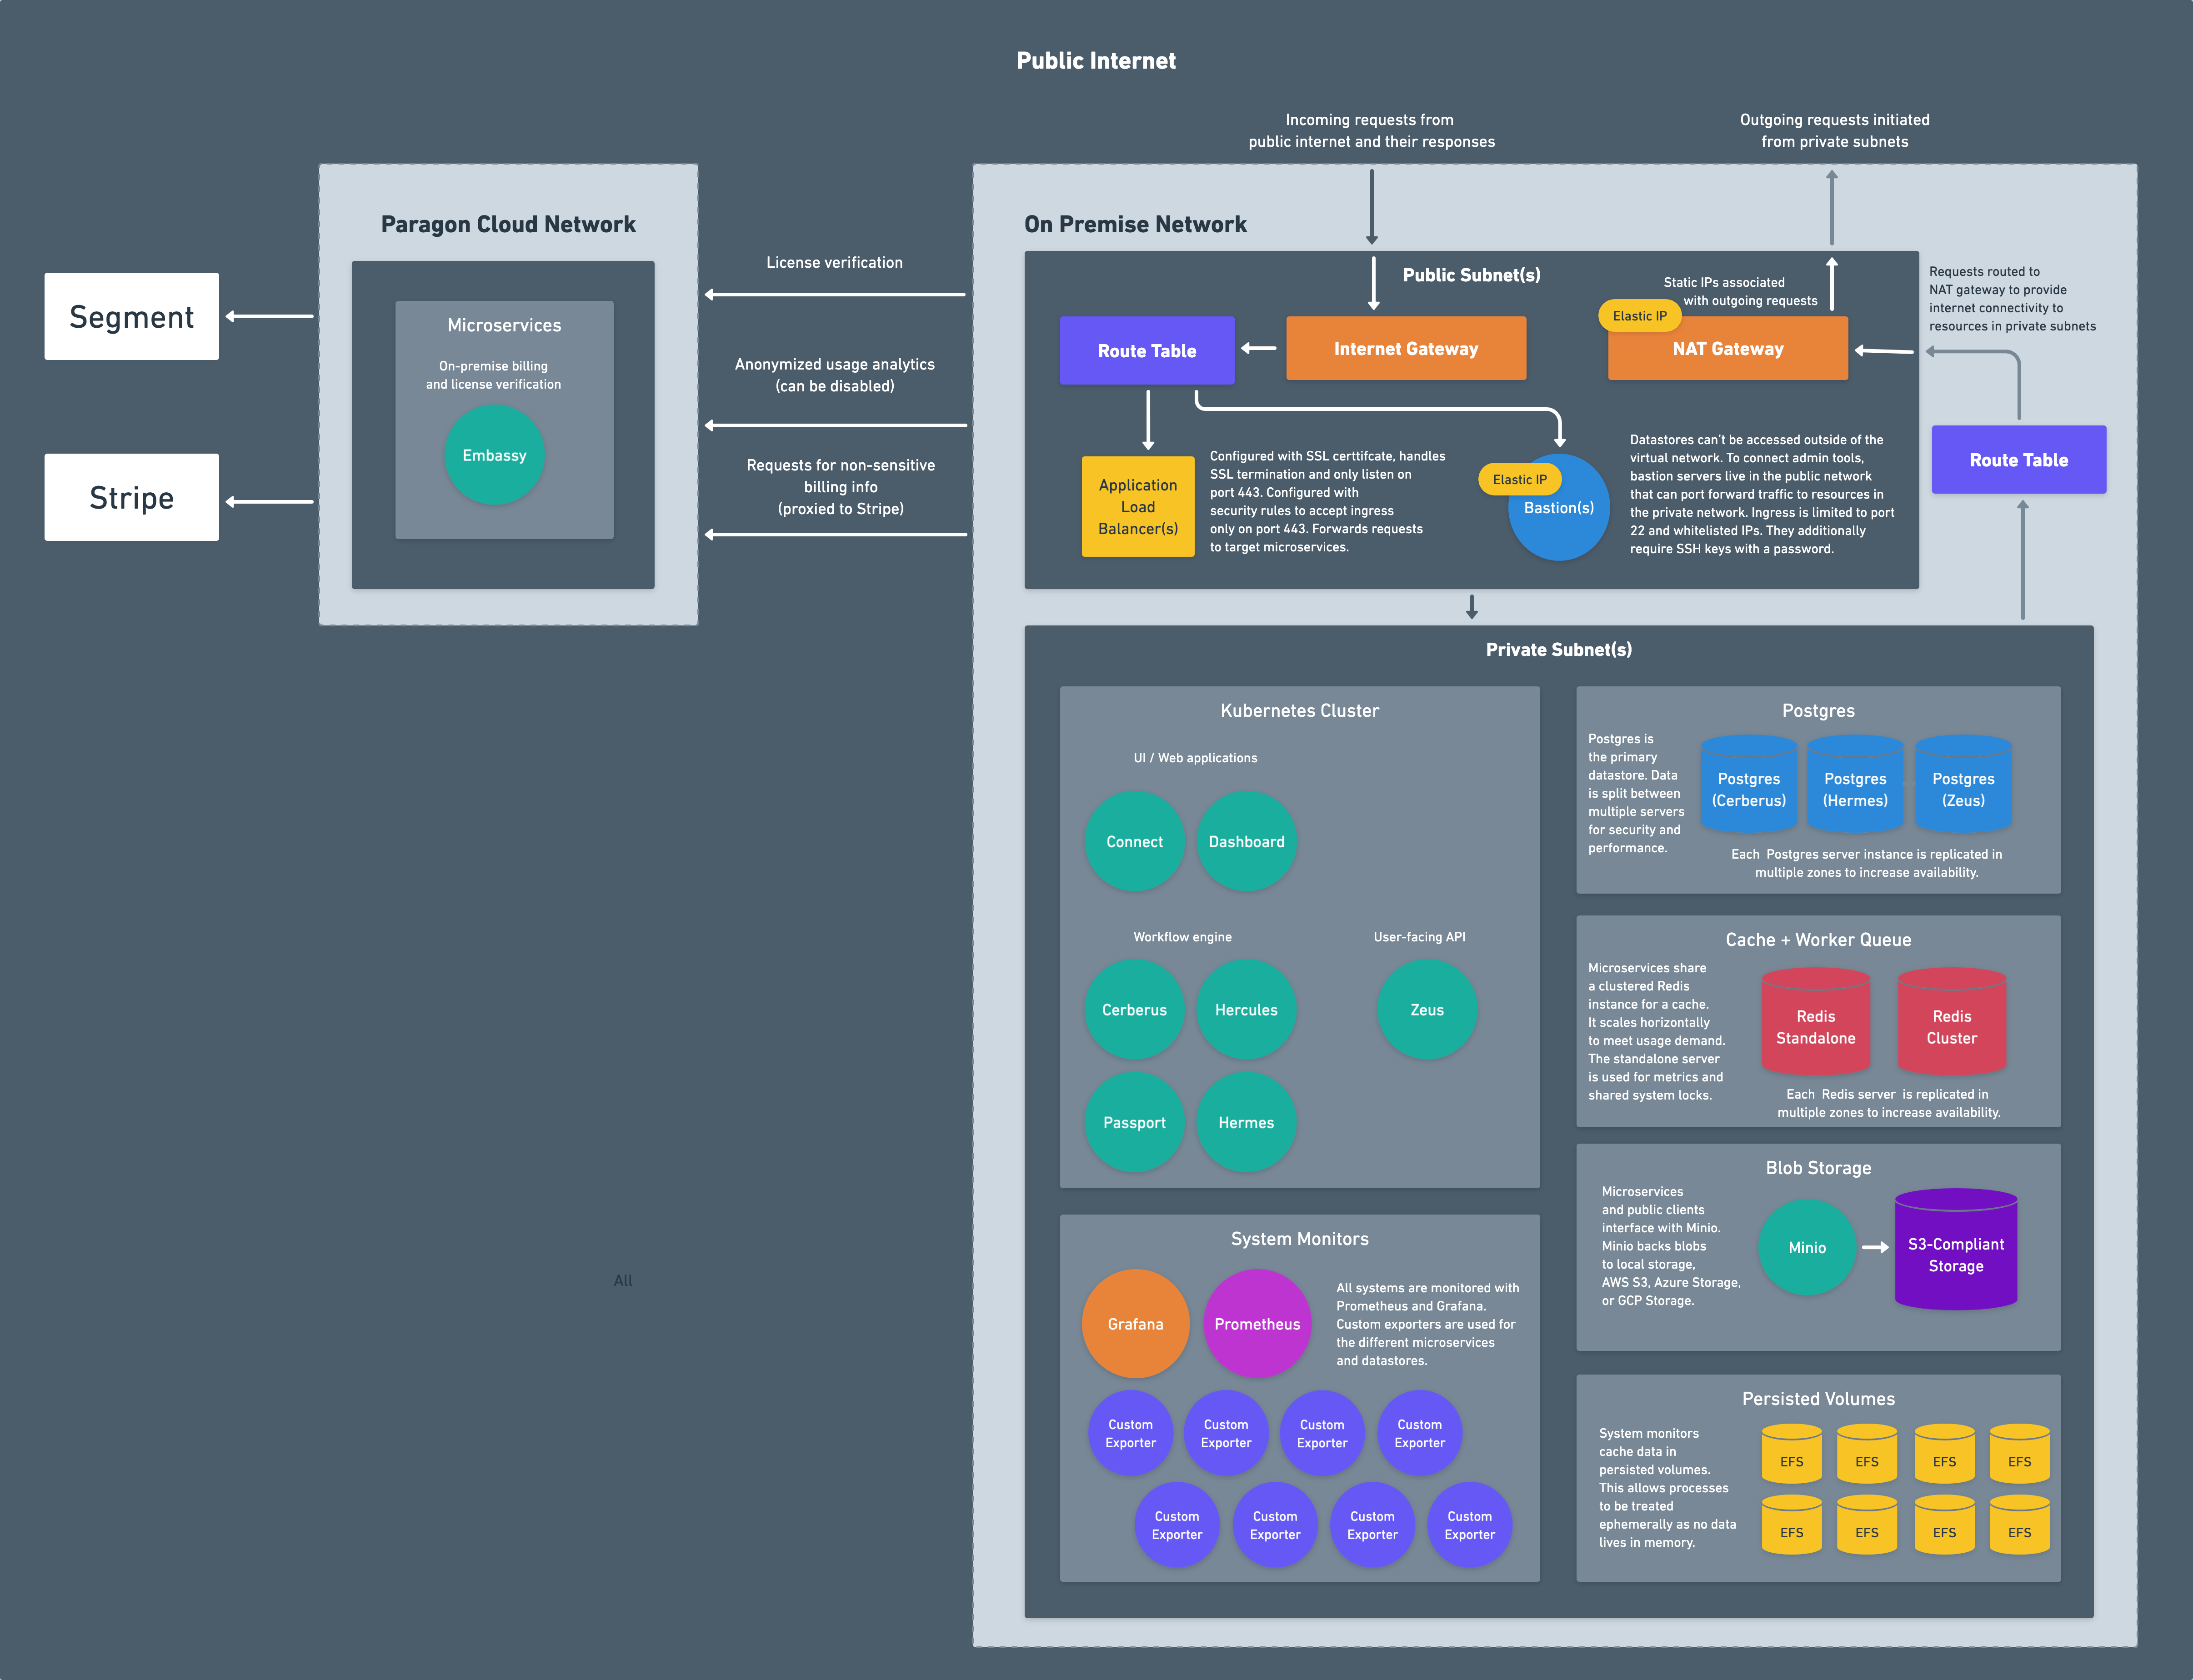
Network
The network consists of:- Virtual Private Cloud: a private network that hosts all of the resources
- Public and Private Subnets: segmented pieces of the network used to limit ingress and egress to resources
- Nat Gateway: network address translation service for connecting services in private network to the public internet
- Internet Gateway: VPC component that allows communication between the VPC and the public internet
- Route Tables: rules and routes that determine network traffic to and from subnets and gateways
- Elastic IP Addresses: IP addresses attached to gateways and bastions
- Load Balancer: resource for distributing incoming network traffic to backend services and exposing them to the public internet
Kubernetes Cluster
Paragon microservices run within a Kubernetes cluster, an open-source system for automating deployment, scaling, and management of containerized applications. AWS, Azure, and GCP all provide managed Kubernetes services that offload the majority of system administration work and are the recommended method for deploying Paragon. You can learn more about each one below:AWS
Azure
GCP
Datastores
Paragon uses three separate datastores for storing data: Postgres, Redis, and an S3-compliant blob storage.Postgres
Postgres is used as the primary datastore. For multi-tenant cloud installations, three separate Postgres servers are provisioned for security and performance. On-premise installations use a single Postgres server for cost savings. Some of the data stored in Postgres includes:- Users, teams and organizations
- Workflow and step configurations
- Metadata on Monitoring (workflow executions)
- Encrypted credentials
Redis
Redis is used as a cache and a worker queue. For multi-tenant cloud installations, a standalone Redis server and a clustered Redis server is provisioned. On-premise installations use a single Redis standalone Redis server for cost savings. Some of the data cached in Redis includes:- System metrics
- Shared system locks to coordinate distributed leader election between microservices
- Expensive Postgres read operations that don’t need real-time stats (e.g. task usage)
- Deployed workflows
S3-Compliant Blob Storage
Files are persisted in an S3-compliant blob storage provider. A custom Minio image has been built that can connect to AWS S3, Azure Blob Storage, or GCP Cloud Storage. Some of the files stored in the blob storage provider include:- Workflow execution data
- User image uploads
- Cached data too large for Redis
Application Microservices
Paragon is built using microservice architecture. The applications are deployed to the Kubernetes cluster using a Helm chart, which is a package manager for Kubernetes. The applications never export or sync data outside of the installation. At most there are only 3 types of requests that hit Paragon’s cloud infrastructure:- License verification. On system bootup and on a periodic cron, the microservices will contact Paragon’s cloud instance to verify that a license is valid and an installation can run.
- Billing information. When viewing your billing pages to get information on number of integrations, monthly / annual costs, etc, the microservices will contact Paragon’s cloud instance to retrieve billing information.
- Anonymous usage analytics. Anonymized usage analytics are sent to Paragon’s cloud instance. This contains metrics like execution count, number of users, integrations used, etc but doesn’t contain any information identifying users or any of the data within the installation. This can be disabled.
System Monitors
Grafana, Prometheus, and several exporters run in each environment that feeds system metrics into Prometheus. These track hundreds of metrics in the load balancers, databases, worker queues, and microservices and have fine-tuned alerts to notify us of deviations or dangerous values. These metrics are only fed into the real-time dashboards running within the installation and never leave the installation. You can read more about these in System Metrics and Alarms.System Metrics and Alarms
Only managed installations (e.g. cloud and managed on-premise) have system monitors. If you’re running an unmanaged on-premise installation, you’ll need to create your own tooling and processes for monitoring CPU and memory, error rates, etc.
Bastion (optional)
The services running in Paragon are primarily in the private subnets, meaning they aren’t exposed to the public internet. To connect to administrative tools like Grafana or Kibana or interact with the Kubernetes cluster viakubectl, a bastion server can optionally be deployed to the installation.
In managed on-premise versions, a bastion is deployed and pre-configured with kubectl, helm, and other useful CLI tools to interact with the installation.