- Load balancer
- Redis
- Postgres
- Postgres worker queue
- Redis worker queue
- Workflow executions
- Connect Proxy Requests
- Microservices
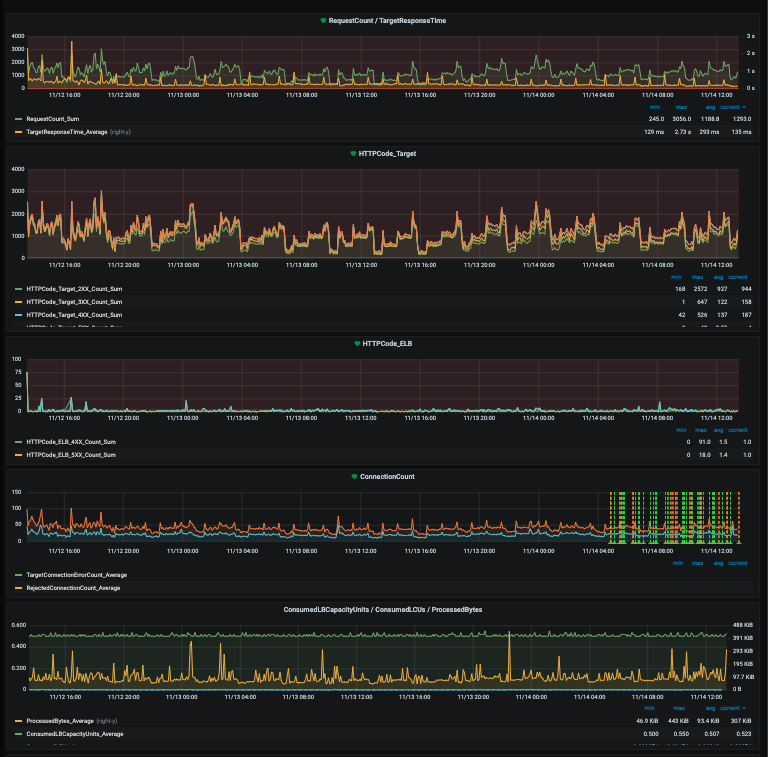
Load balancer
Metrics and alarms include:- Request count / response time
- HTTP response codes
- Connection count
- Bytes processed
- TLS errors
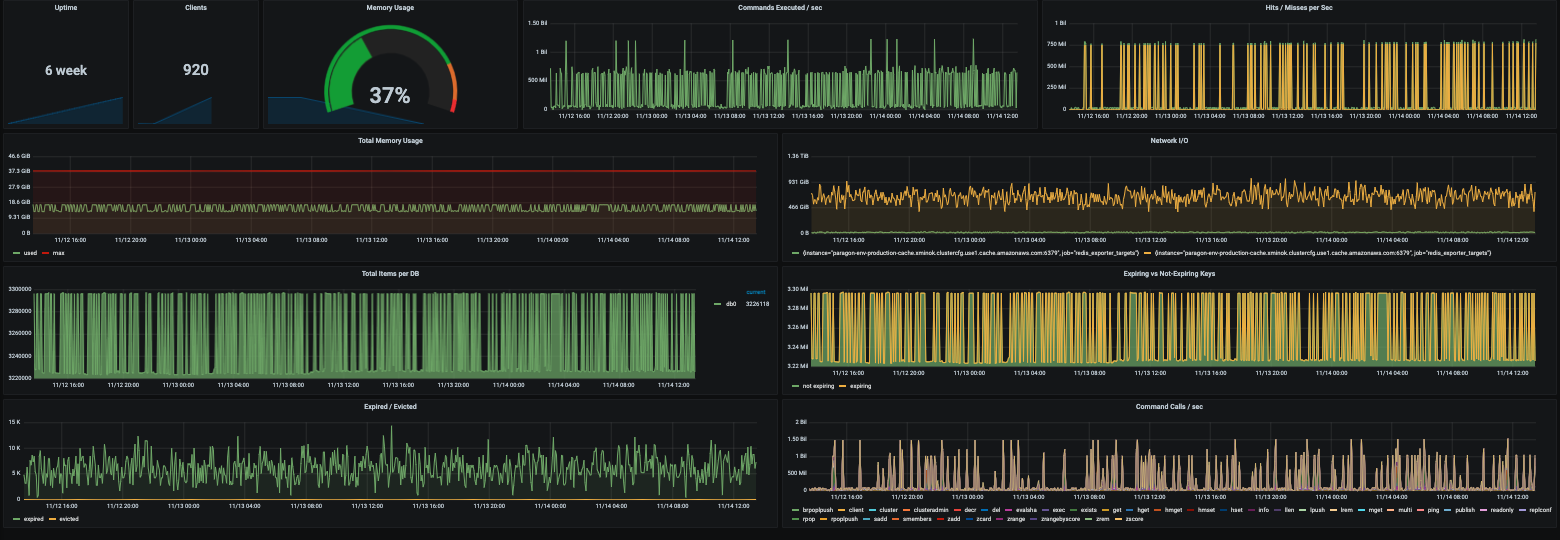
Redis
Metrics and alarms include:- Uptime
- Clients
- Memory usage
- Commands executed/second
- Hits/misses per second
- Total items per database
- Network I/O
- Expiring vs non-expiring keys
- Expired/evicted
- Command calls/second
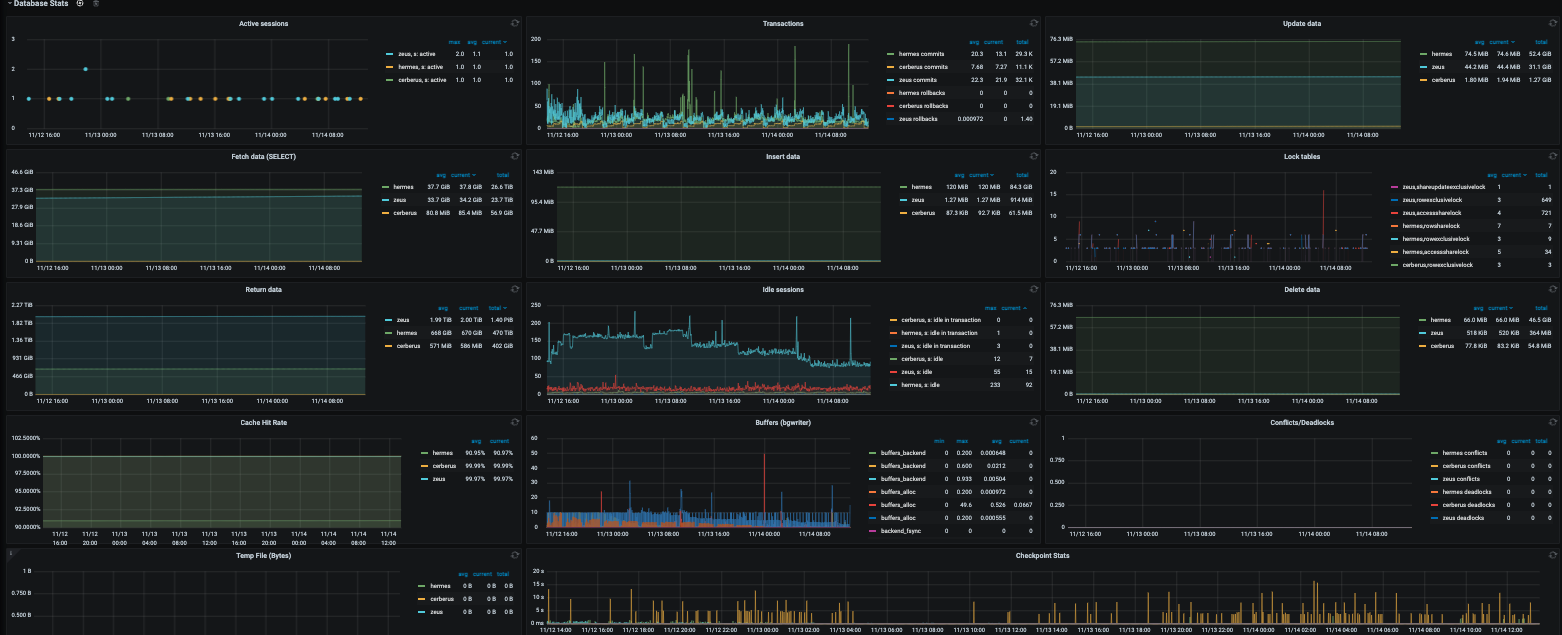
Postgres
Metrics and alarms include:- CPU usage
- Memory usage
- Transactions
- Locks
- Conflicts/deadlocks
- Cache hit rate
Postgres Worker Queue
Metrics and alarms include:- Workers
- Throughput
- Average wait
- Job statuses
- Job duration
- Error rate
- Average wait per queue
- Workers per queue
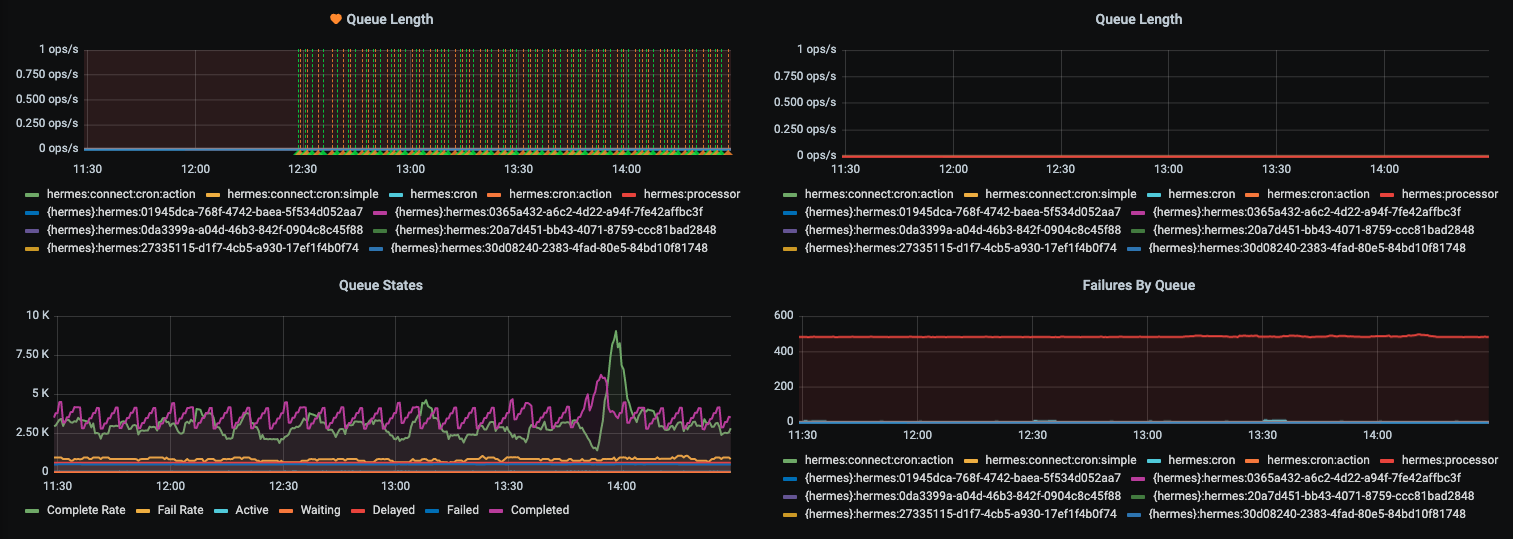
Redis Worker Queue
Metrics and alarms include:- Queue length
- Queue states
- Failures by queue
- Job duration
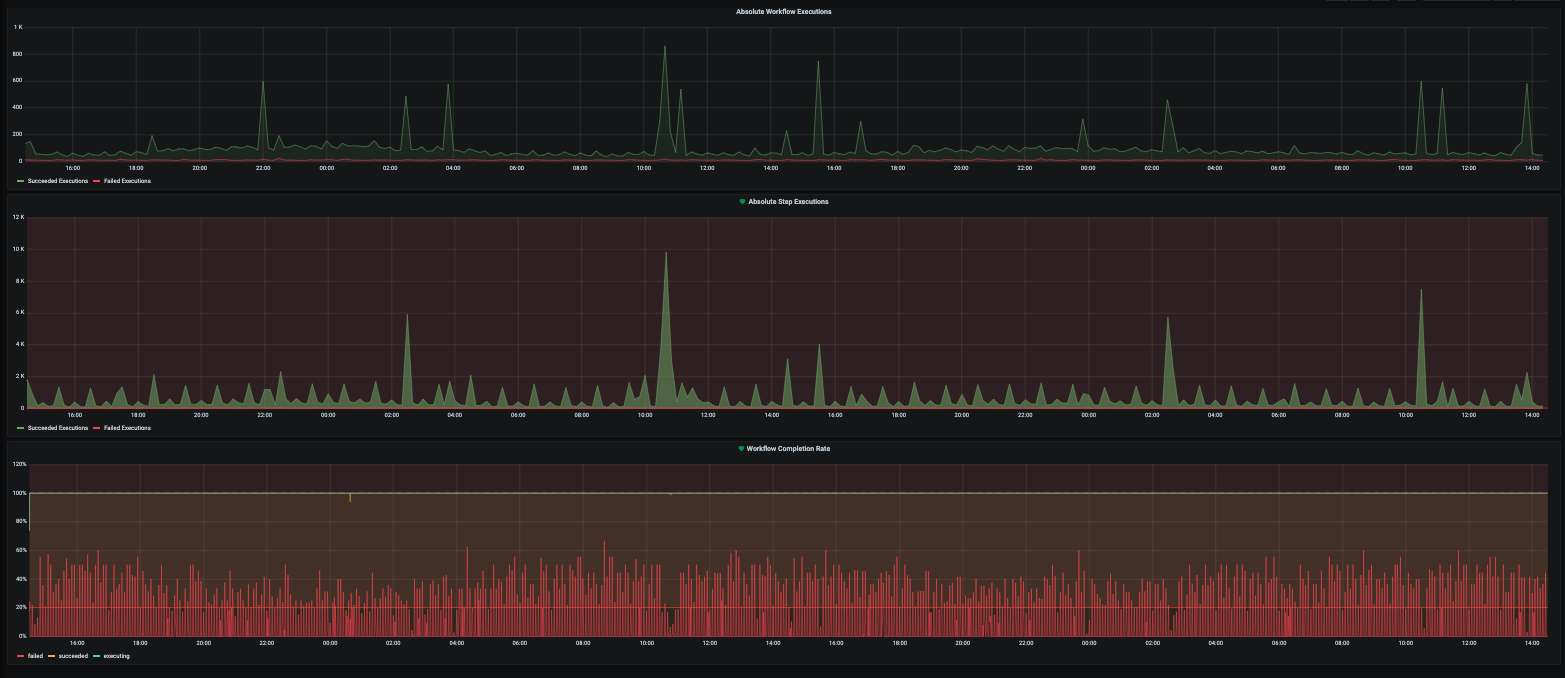
Workflow Executions
Metrics and alarms include:- Workflow executions
- Step executions
- Workflow completion rate
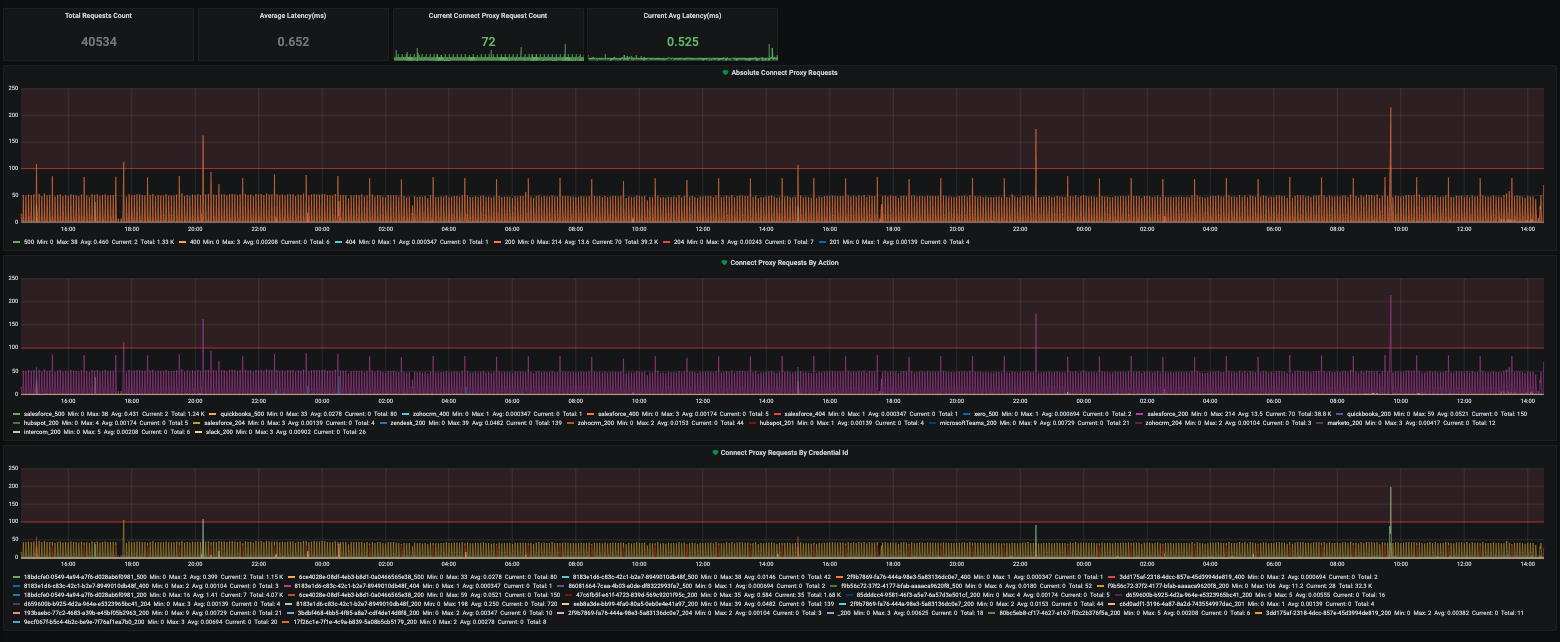
Connect Proxy Requests
Metrics and alarms include:- Total request count
- Latency
- Open requests
- Status code
- Status code by integration
- Status code by credential
Microservices
Metrics and alarms include:- Requests
- Apdex score
- Error rate
- Event loop lag
- CPU
- Heap
- Request duration