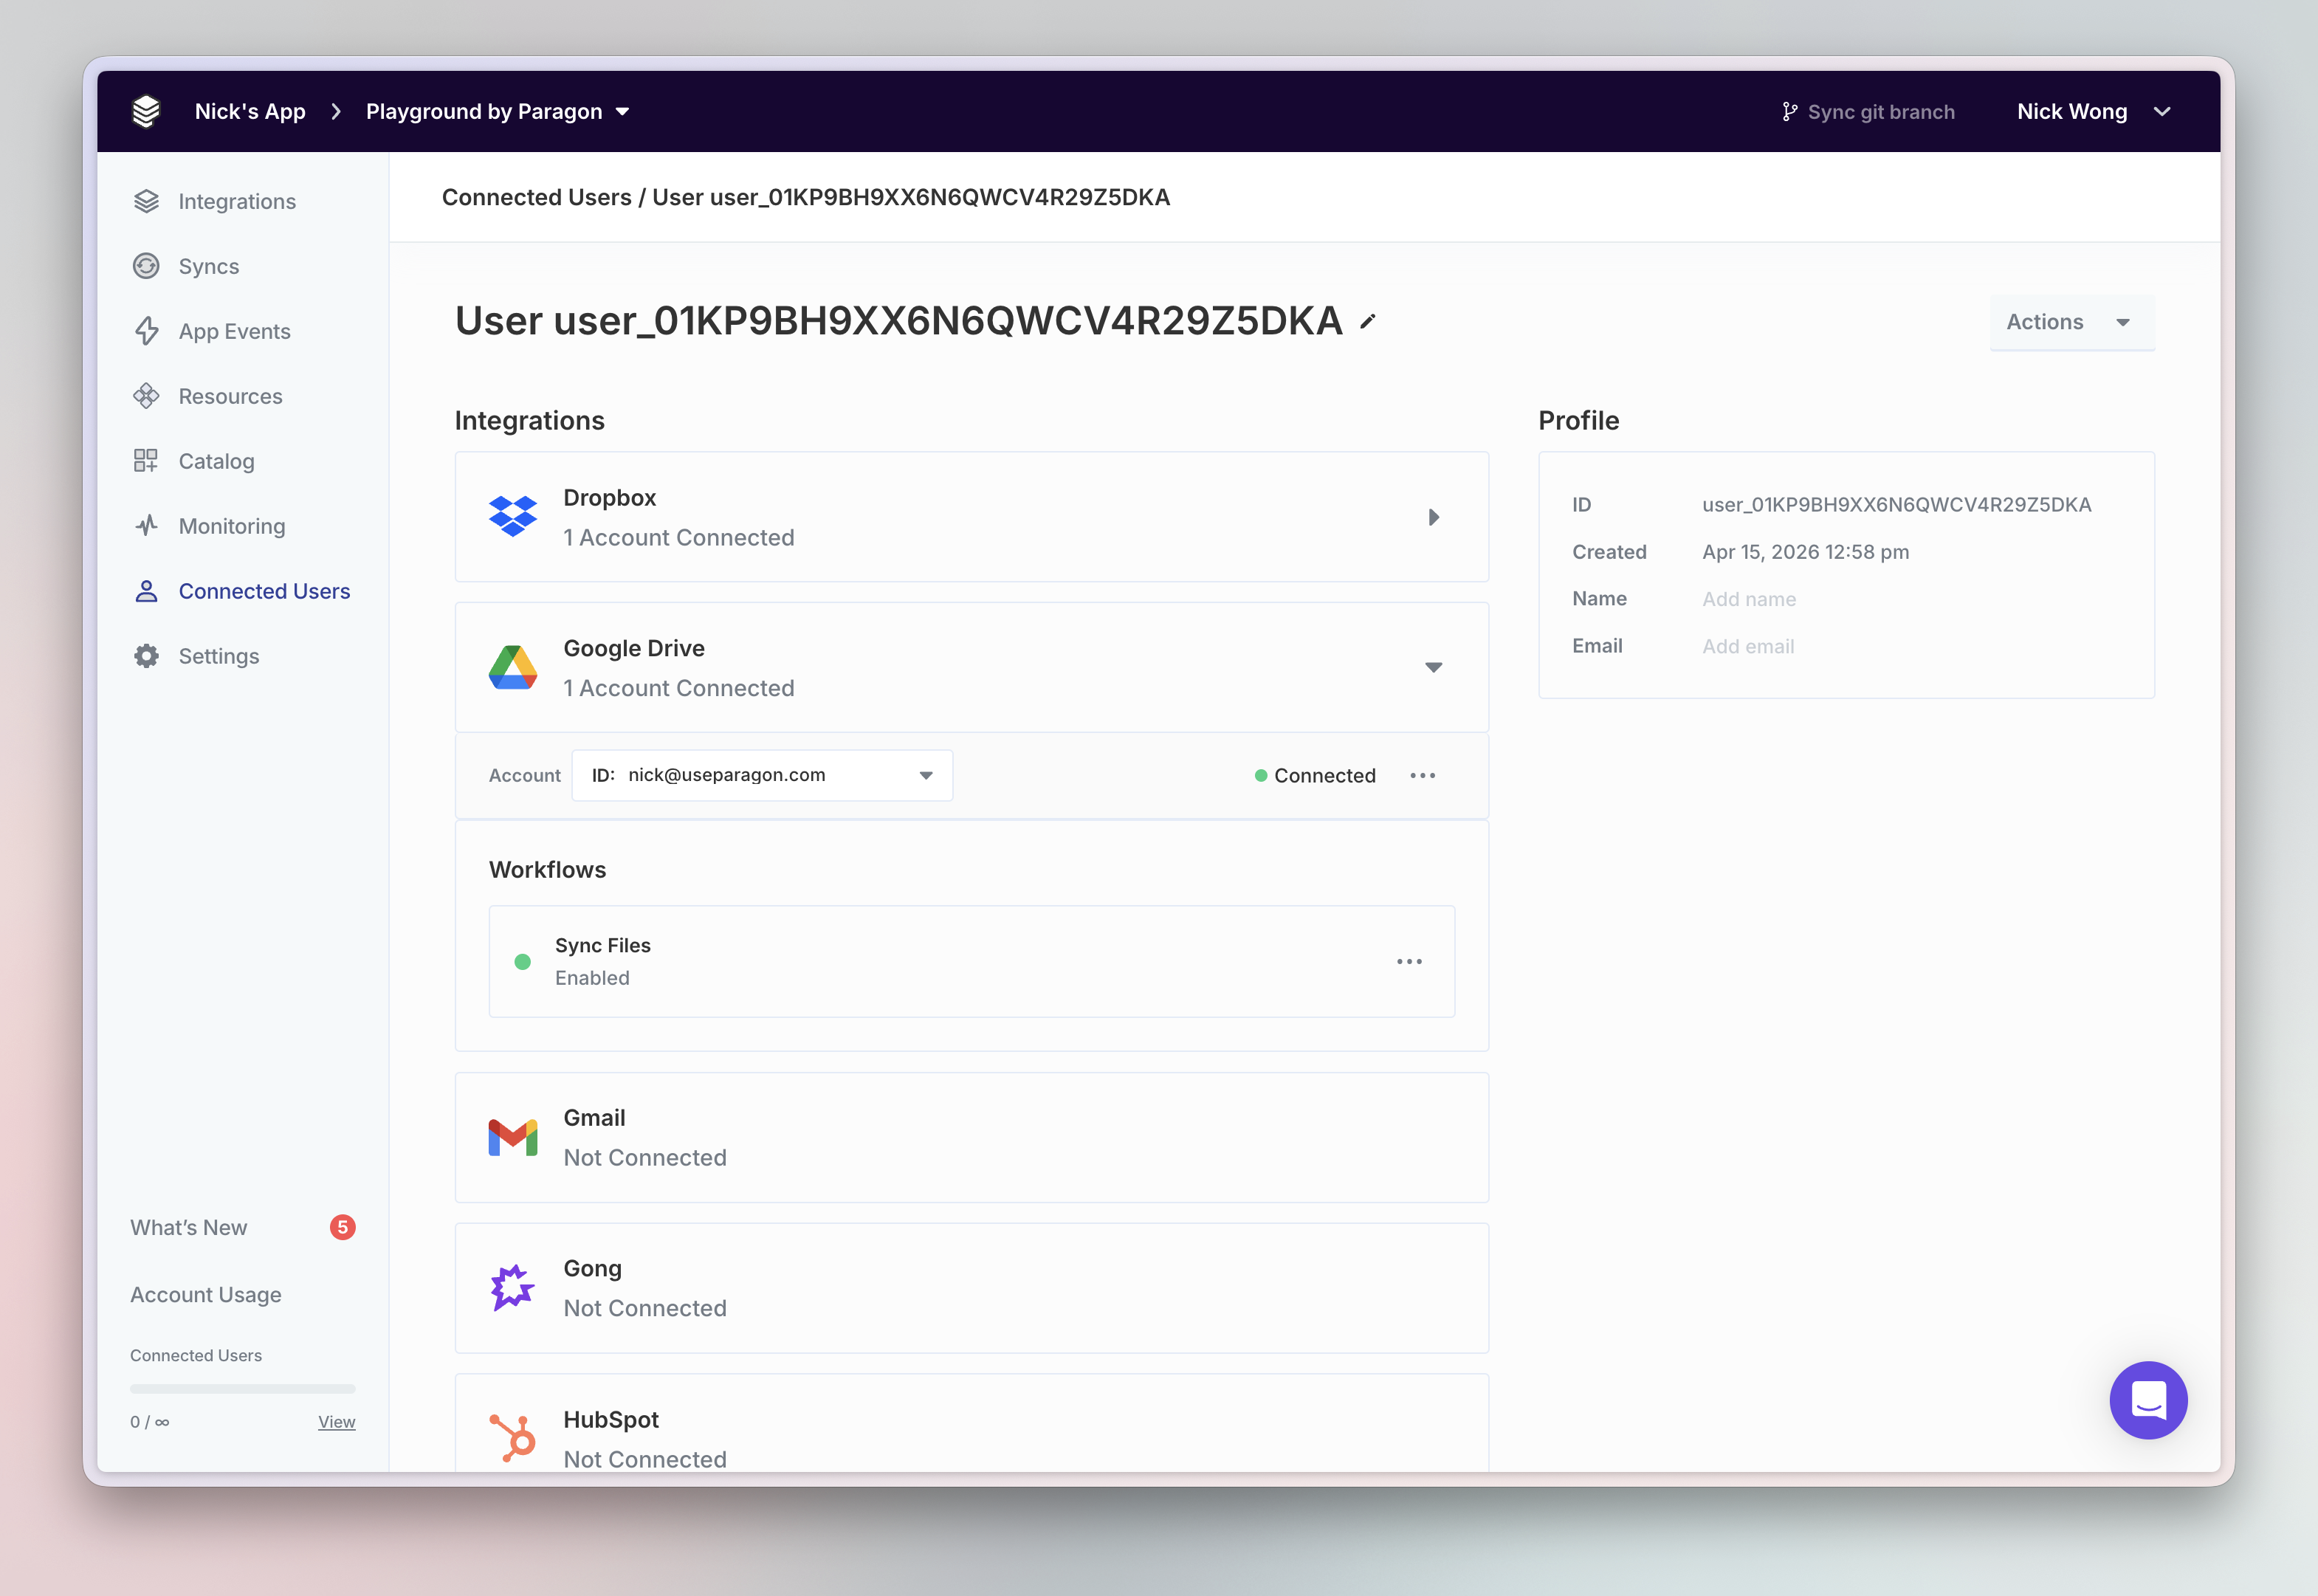
View connected integrations in the Connected Users Dashboard.
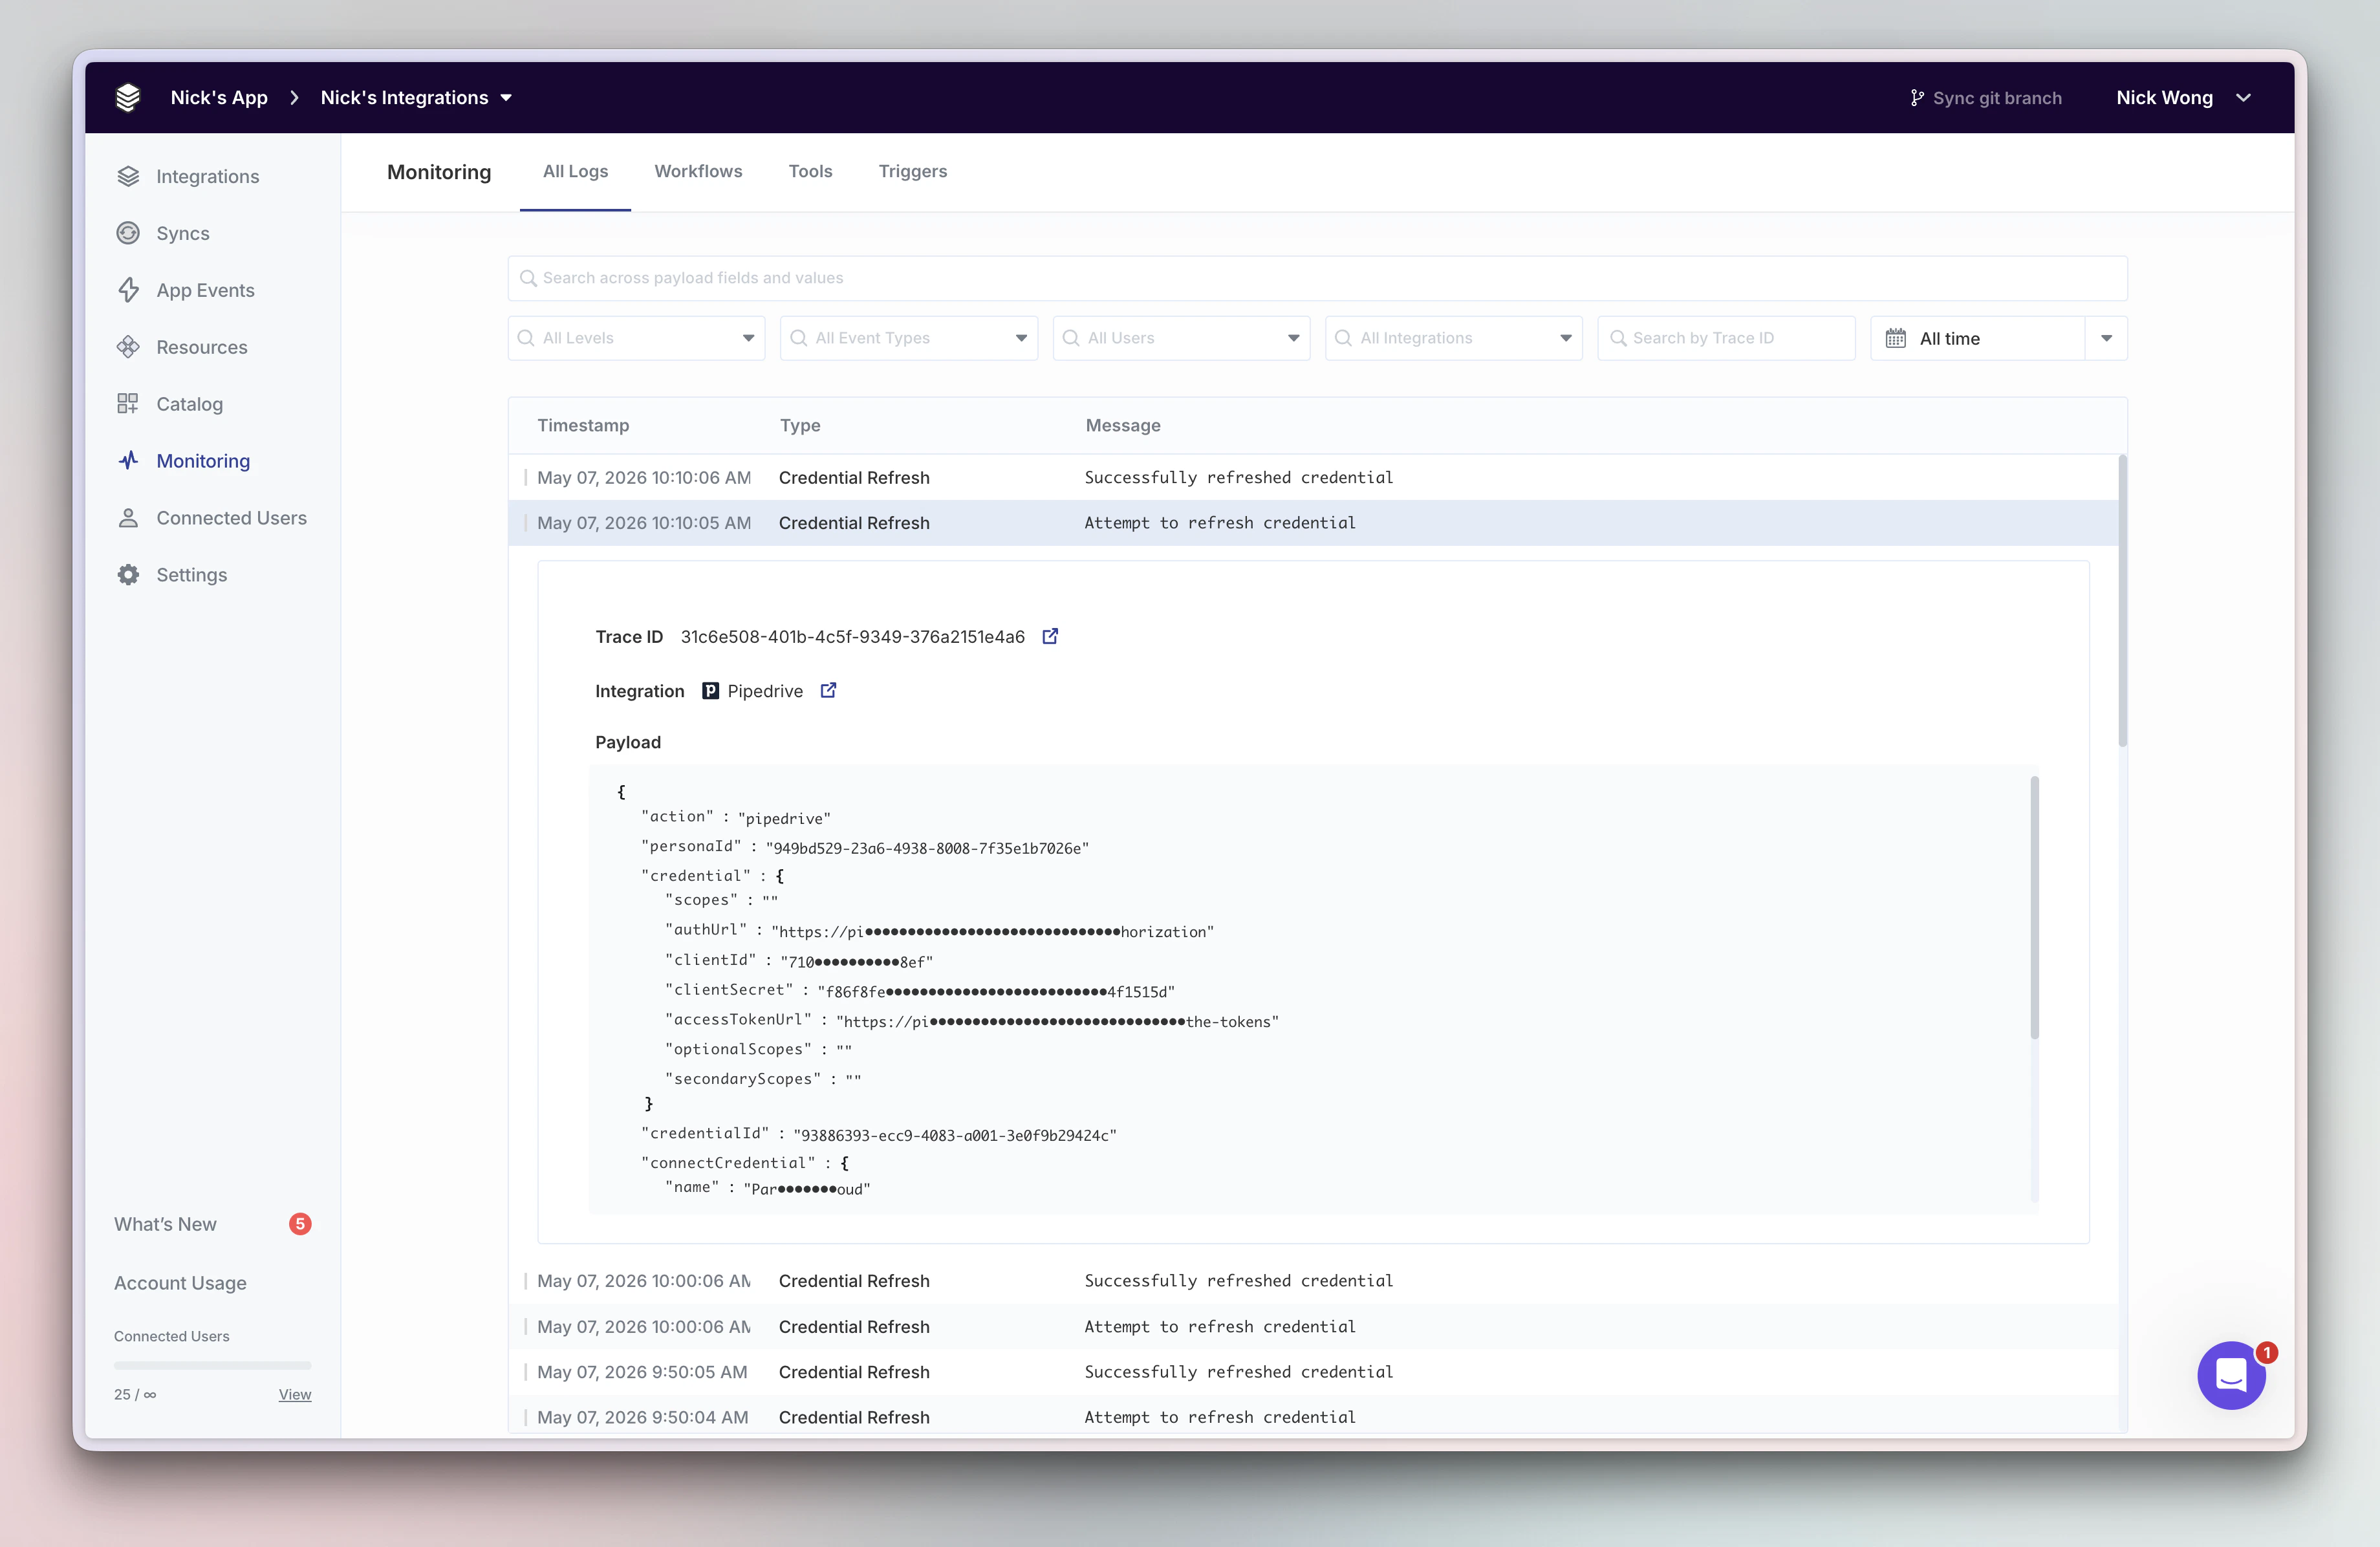
Product-specific Monitoring Views
Products on the Paragon platform each have a dedicated Monitoring view to provide a tailored debugging and observability experience. Found in the Monitoring tab in left sidebar of the dashboard, these views provide chronological timelines across Paragon product events:- All Logs - Search and filter the atomic logs spanning all events in your Paragon project.
- Workflows - Review workflow executions, with step-by-step breakdowns and failure details.
- Tools - Debug and inspect ActionKit tool calls and payloads in real-time.
- Triggers - Review Triggers API subscription events and payloads in real-time.
Extend Monitoring to Your Own Observability Stack with APIs
When you need to extend Monitoring to your own observability platforms or get notified in real-time of warnings and errors across your integration stack, you can use the Event Destinations and Task History API.Discover Event Destinations
Learn more about sending warnings to the services your team uses internally like Slack, Datadog, Sentry, and more.
Discover Task History API
Learn more about querying workflows usage and history using the Task History API.