Overview
Quickly search, view, and trace through logs of your ActionKit calls on the Monitoring page of your Paragon dashboard. There are two tabs in Monitoring for ActionKit:- The Tools tab provides a timeline of all ActionKit Tool usage, including all List and Run Tool requests.
- The Triggers tab provides a timeline of all subscribed ActionKit Triggers, including the full lifecycle of subscribing to triggers, detecting new data, and delivering events to your webhook.
Tool Logs
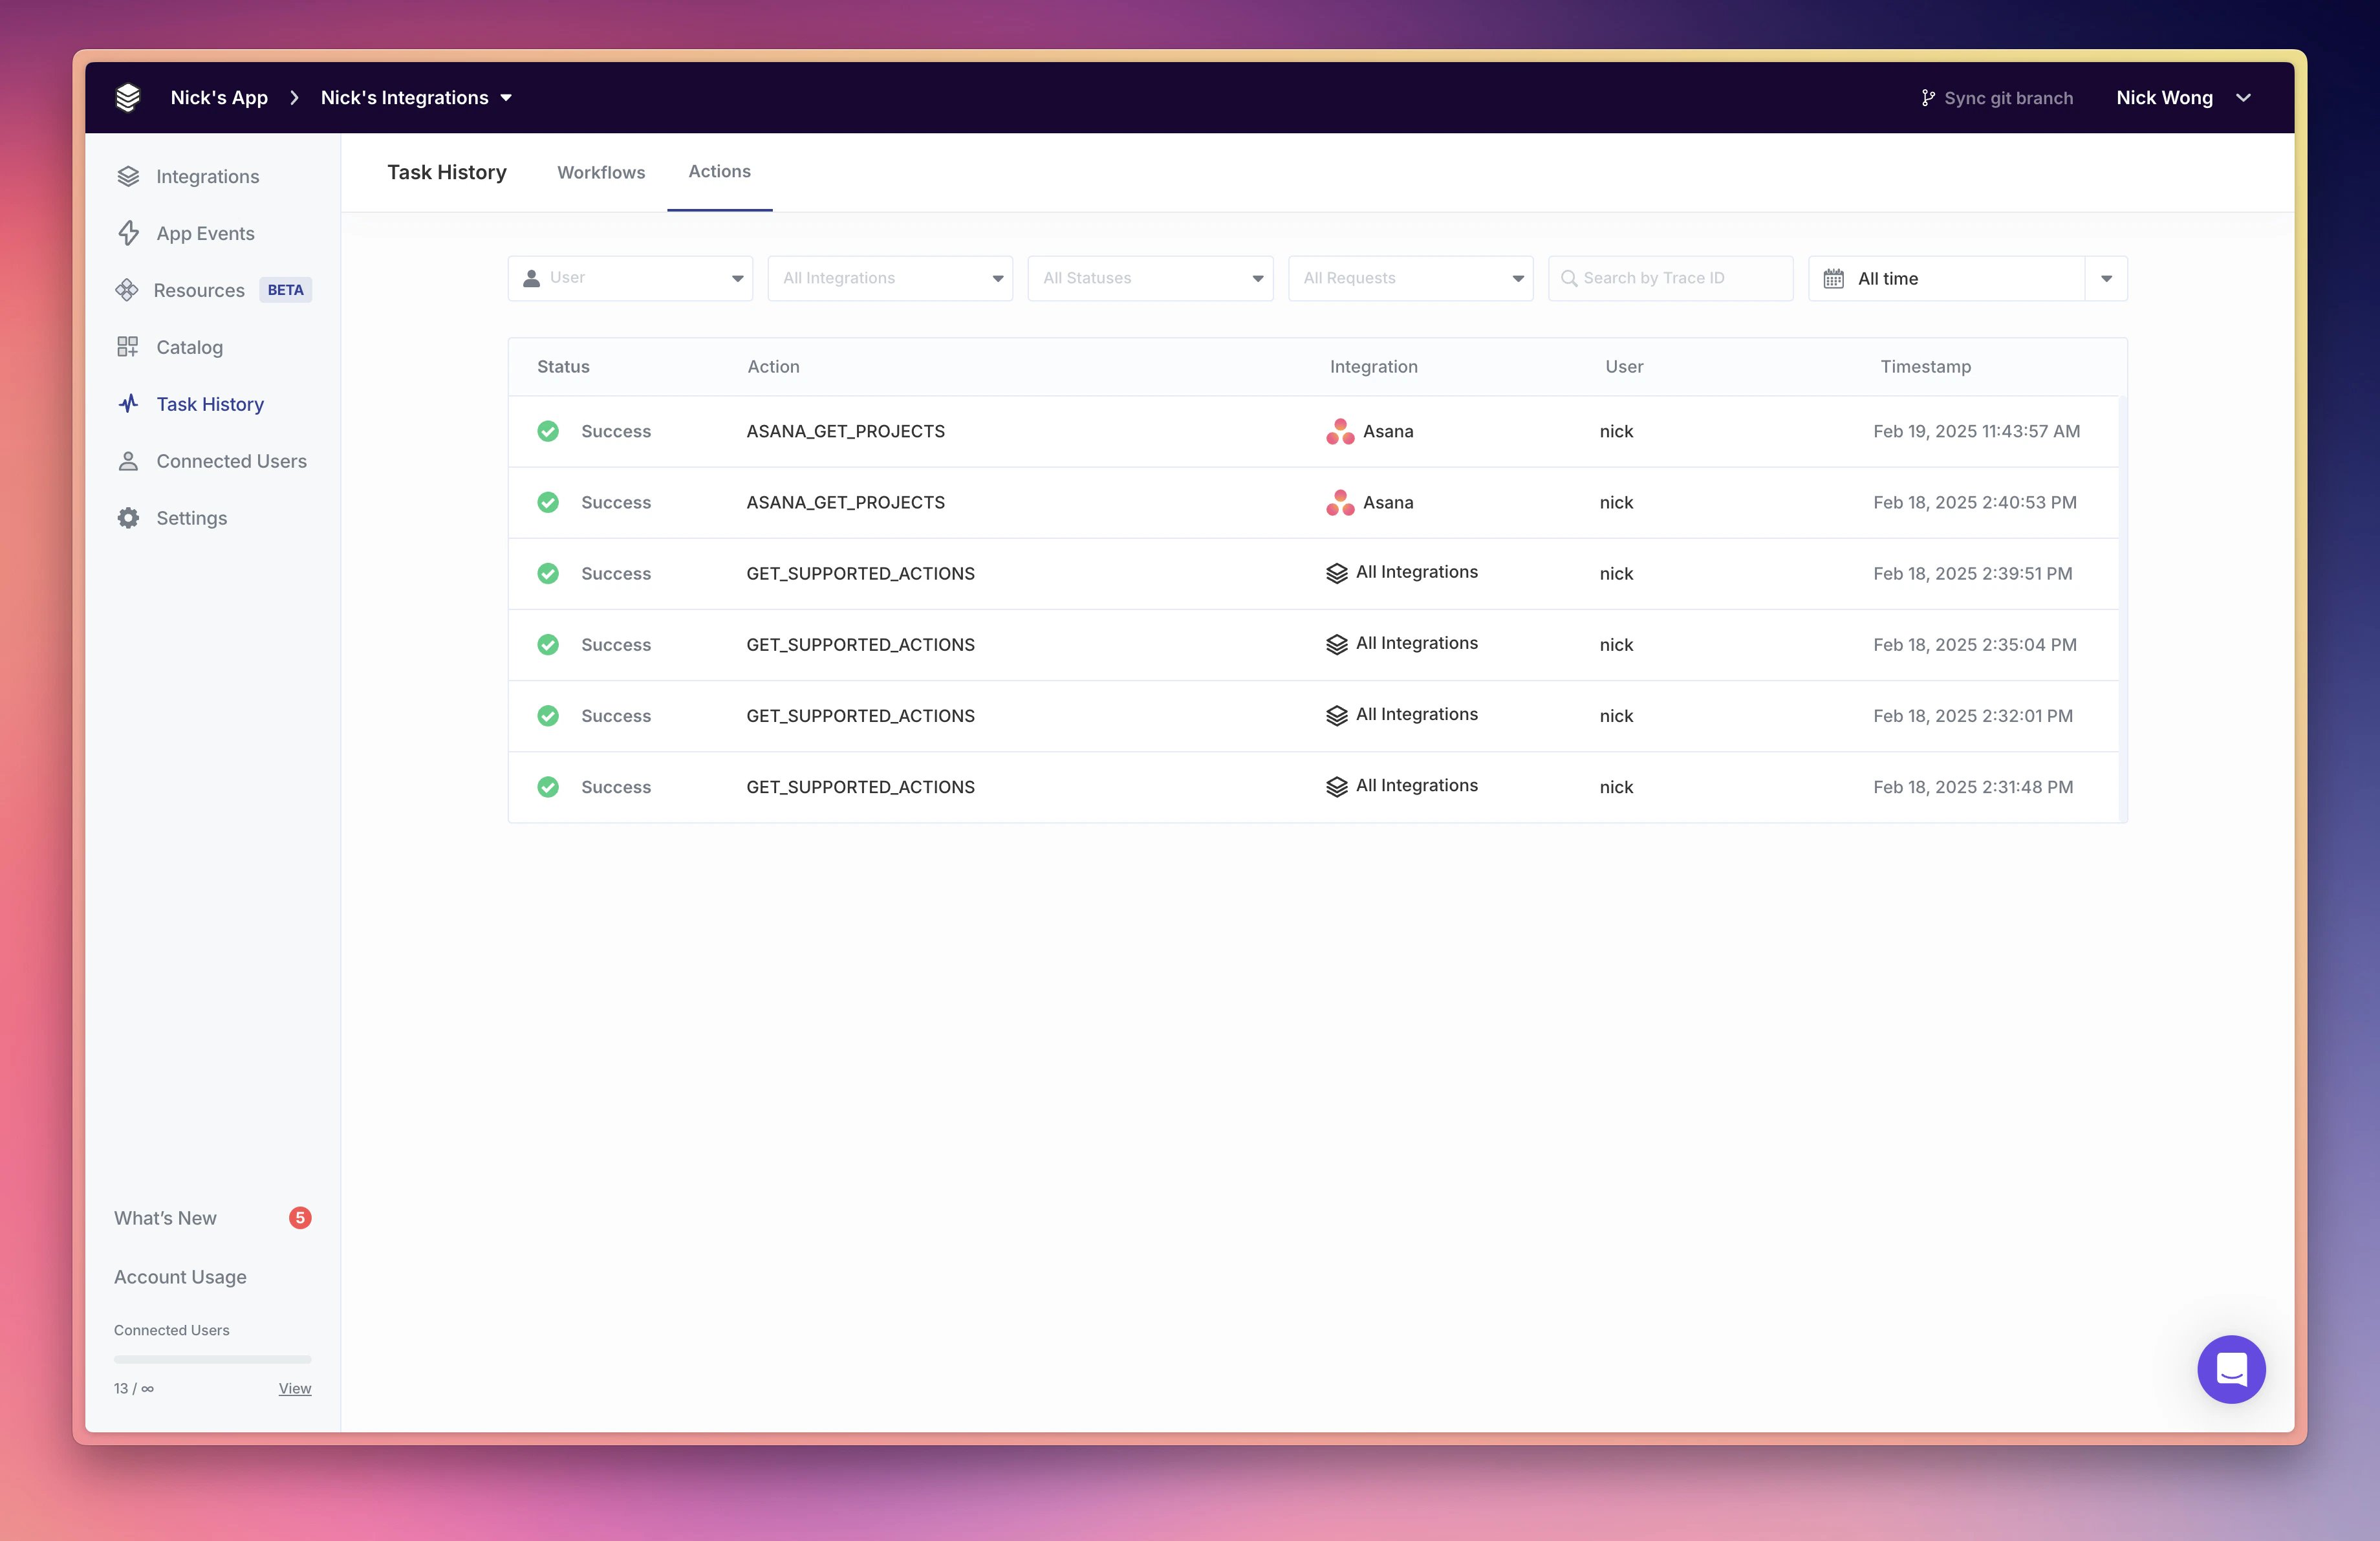
Visit the Tools Tab in Monitoring to find a list of your historical Tool calls. You can use this tab to:- Understand how your AI agent is performing ActionKit calls on behalf of your users.
- Investigate why Tool calls fail for particular Connected Users.
- Discover which ActionKits requests your users are utilizing and the parameters used to make those requests.
Filtering
Filters allow you to view the history of specific requests that meet criteria, including:- User ID
- Integration name
- Status
- Tool name
-
Trace ID
When an ActionKit request errors, a trace or
requestIdis returned via the API response. Provide this ID to filter for the request.Sample ActionKit error response with a requestId - Date range: Filter by the date the ActionKit request was received by Paragon.
Tool Log Trace
Clicking into a Tool call row opens a Log Trace view, which shows all logs associated with a single Tool call.
Note: The response body of API requests are only displayed for Error-level logs. All other logs do not include the contents of the body.
Trigger Logs
The Triggers tab in Monitoring displays a table of all trigger events for your project. You can click on any trigger event row to open a detail panel that shows the full context of that event, including its deliveries and event logs.Trigger Event Detail
The top of the detail panel shows key information about the trigger event:- Event ID: the unique identifier for the trigger event.
- Integration: the integration that produced the event.
- Time Received: when the event was received by Paragon.
- Status: the current processing status of the event (Success, Delivery Failures, Processing Failure, or Queued).
Deliveries
The deliveries section shows how the trigger event was delivered to your subscribed users. Each delivery includes:- Status: whether the delivery succeeded, failed, or is still pending.
- User: the end user ID the delivery was sent to.
- Timestamp: when the delivery was created.
Event Logs
The event logs section shows a timeline of logs associated with the trigger event. You can expand any log entry to view its full payload, including the Trace ID and log context. This is useful for debugging trigger processing issues and understanding how an event moved through Paragon. You will see logs for:- Attempts or failures to deliver a received trigger event to your webhook URL
- Triggers with a
POLLINGsubscription model:- New or updated records detected by the trigger’s polling job
- Triggers with a
WEBHOOKsubscription model:- The original webhook events received by Paragon
- Attempts or failures to create a webhook in a specific integration on behalf of your user
Filtering Trigger Events
You can filter the Triggers table by:- User ID
- Integration
- Status (Success, Delivery Failures, Processing Failure, Queued)
- Date range
Log Retention
ActionKit Logs are rotated automatically based on limits to your Paragon plan’s retention and storage policy. When you reach the maximum lifetime or number of logs that your plan supports, Paragon will automatically drop the oldest logs from the system.Interested in forwarding logs to your own system? Contact us for more details.