> ## Documentation Index
> Fetch the complete documentation index at: https://docs.useparagon.com/llms.txt
> Use this file to discover all available pages before exploring further.
# Monitoring
> Track every step of your integration pipeline with observability into user connections, workflow executions, tool calls, and more.
 From the moment a user connects their first integration, Monitoring gives you a comprehensive view of your integration's stack in a Paragon project.
Dive deep into your user's lifecycle with detailed logs around user connections, triggers, actions, syncs, and more.
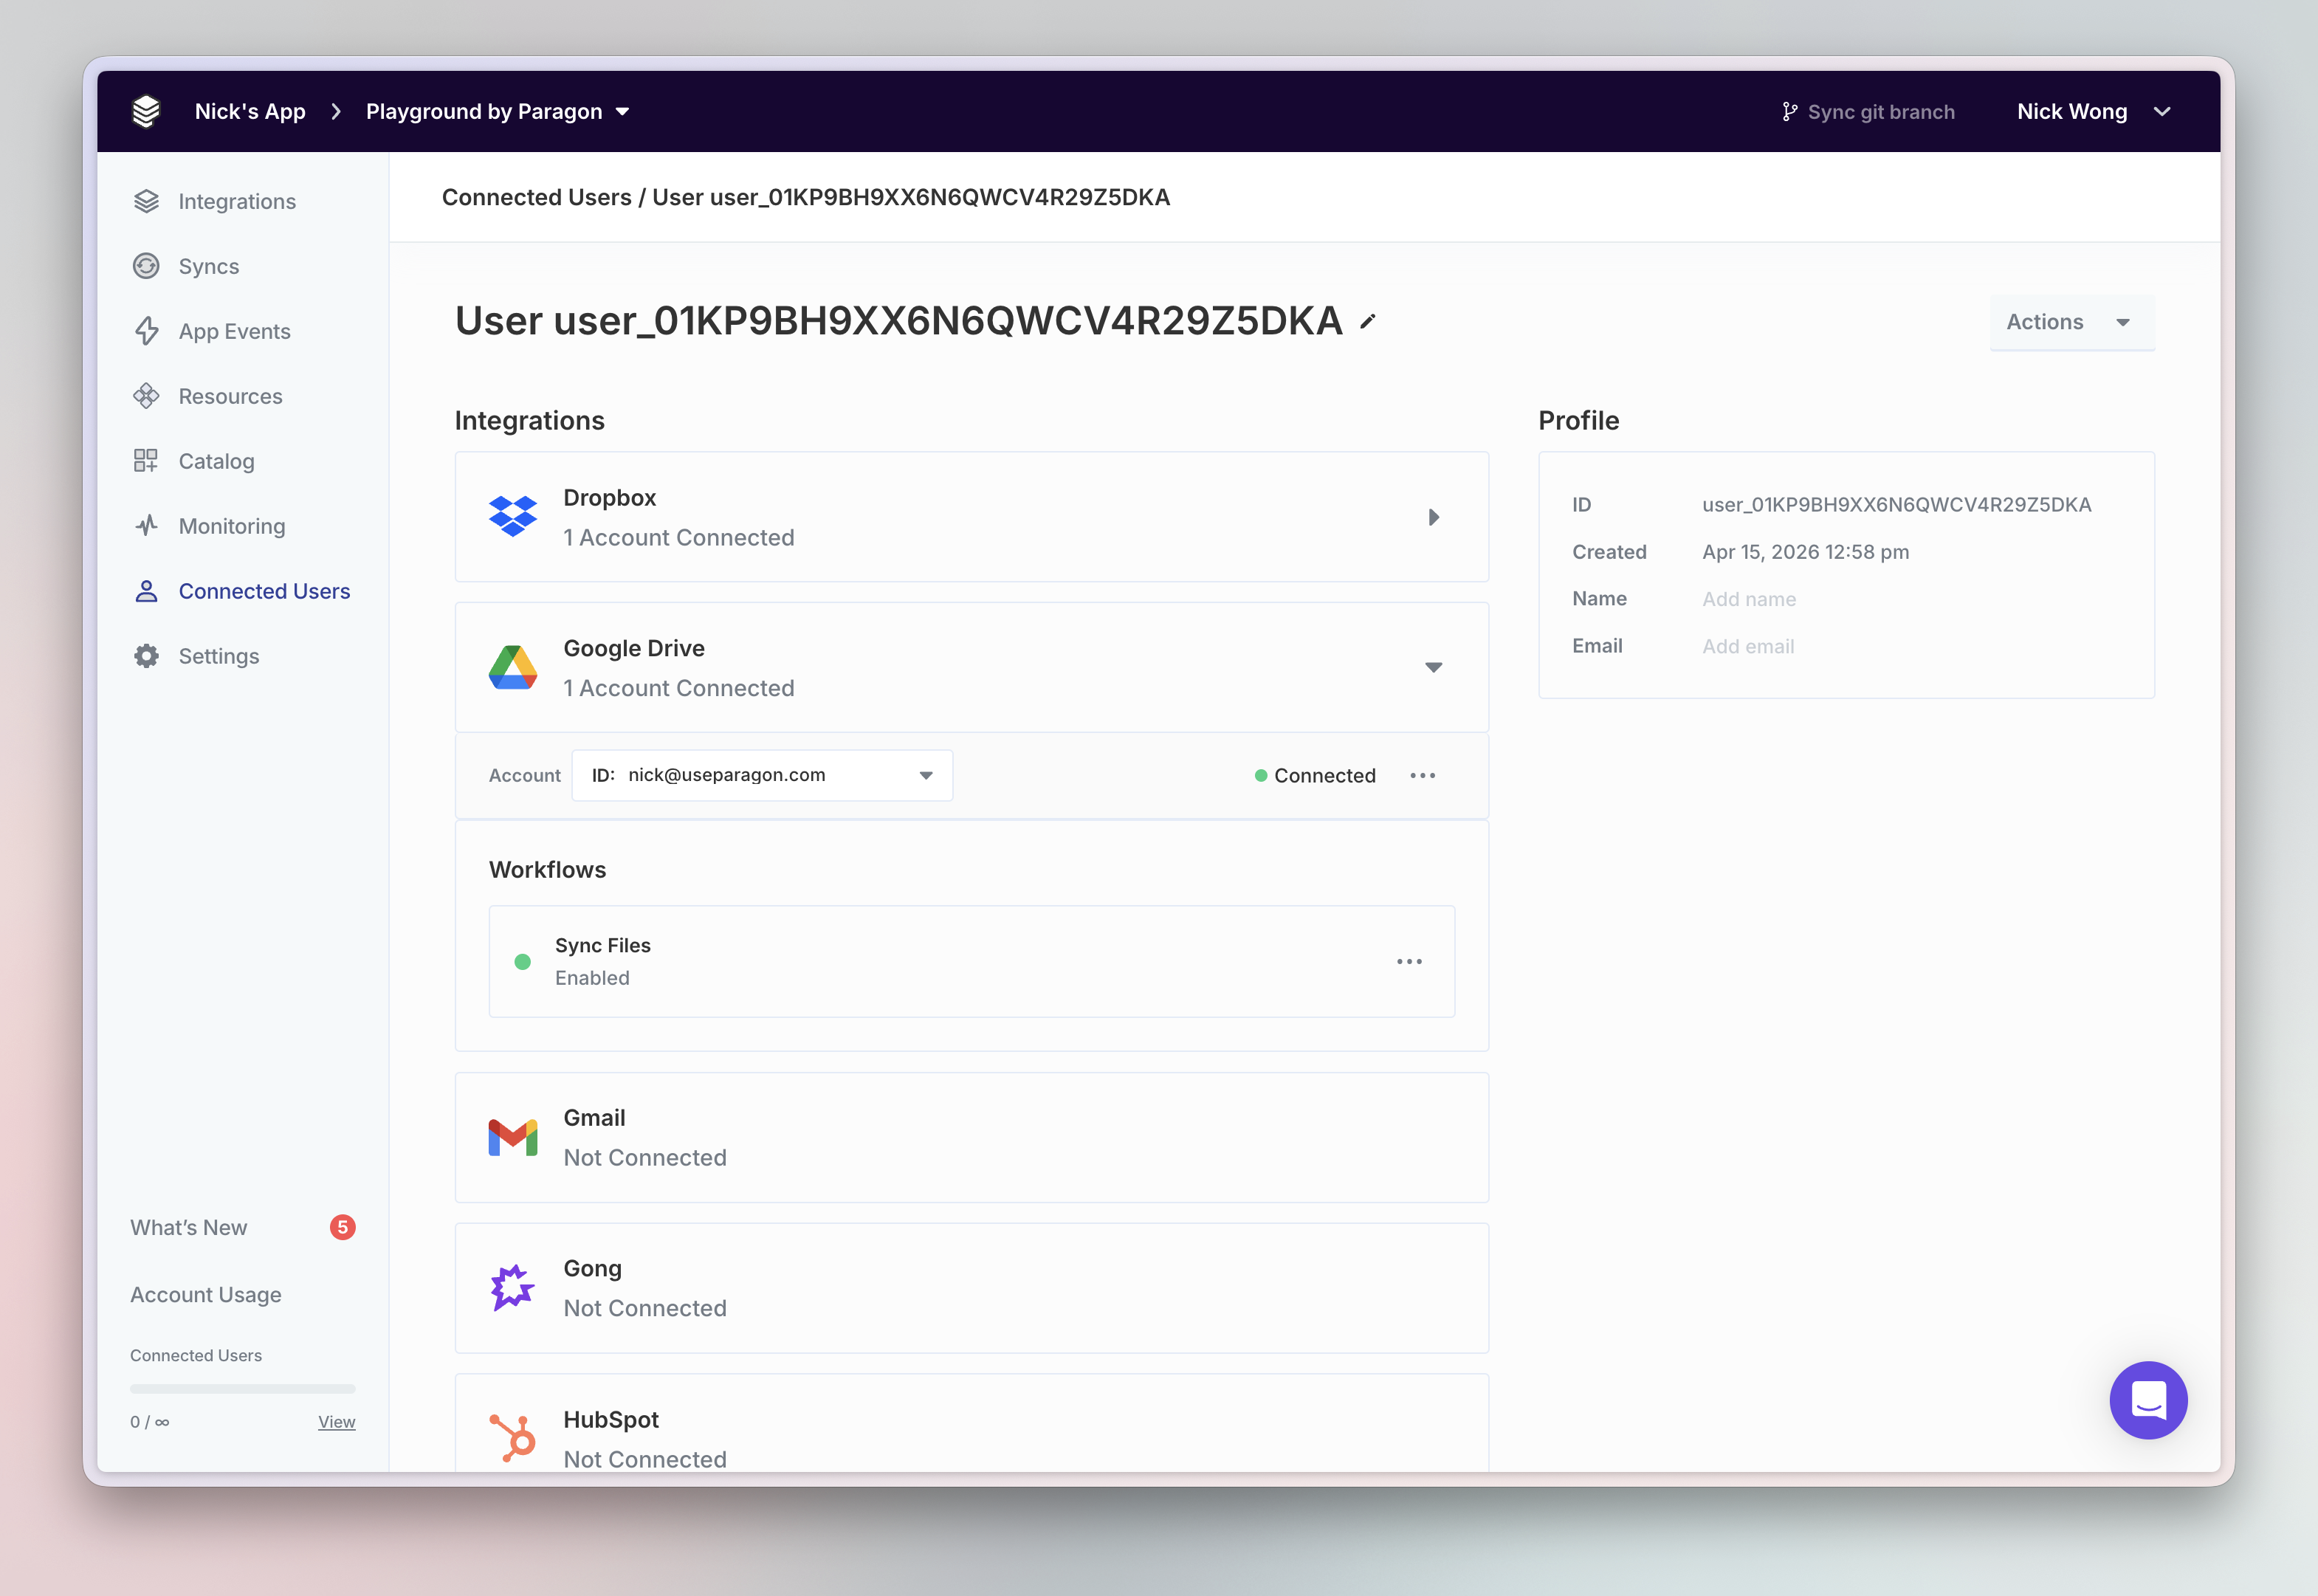
The [Connected Users](/monitoring/users) dashboard is a control panel for your users' integrations and their health. When a user connects an integration on your app,
their connection status will be documented here. See, manage, and debug the state of the connected integrations, enable Workflows, and view associated Triggers from this view.
From the moment a user connects their first integration, Monitoring gives you a comprehensive view of your integration's stack in a Paragon project.
Dive deep into your user's lifecycle with detailed logs around user connections, triggers, actions, syncs, and more.
The [Connected Users](/monitoring/users) dashboard is a control panel for your users' integrations and their health. When a user connects an integration on your app,
their connection status will be documented here. See, manage, and debug the state of the connected integrations, enable Workflows, and view associated Triggers from this view.
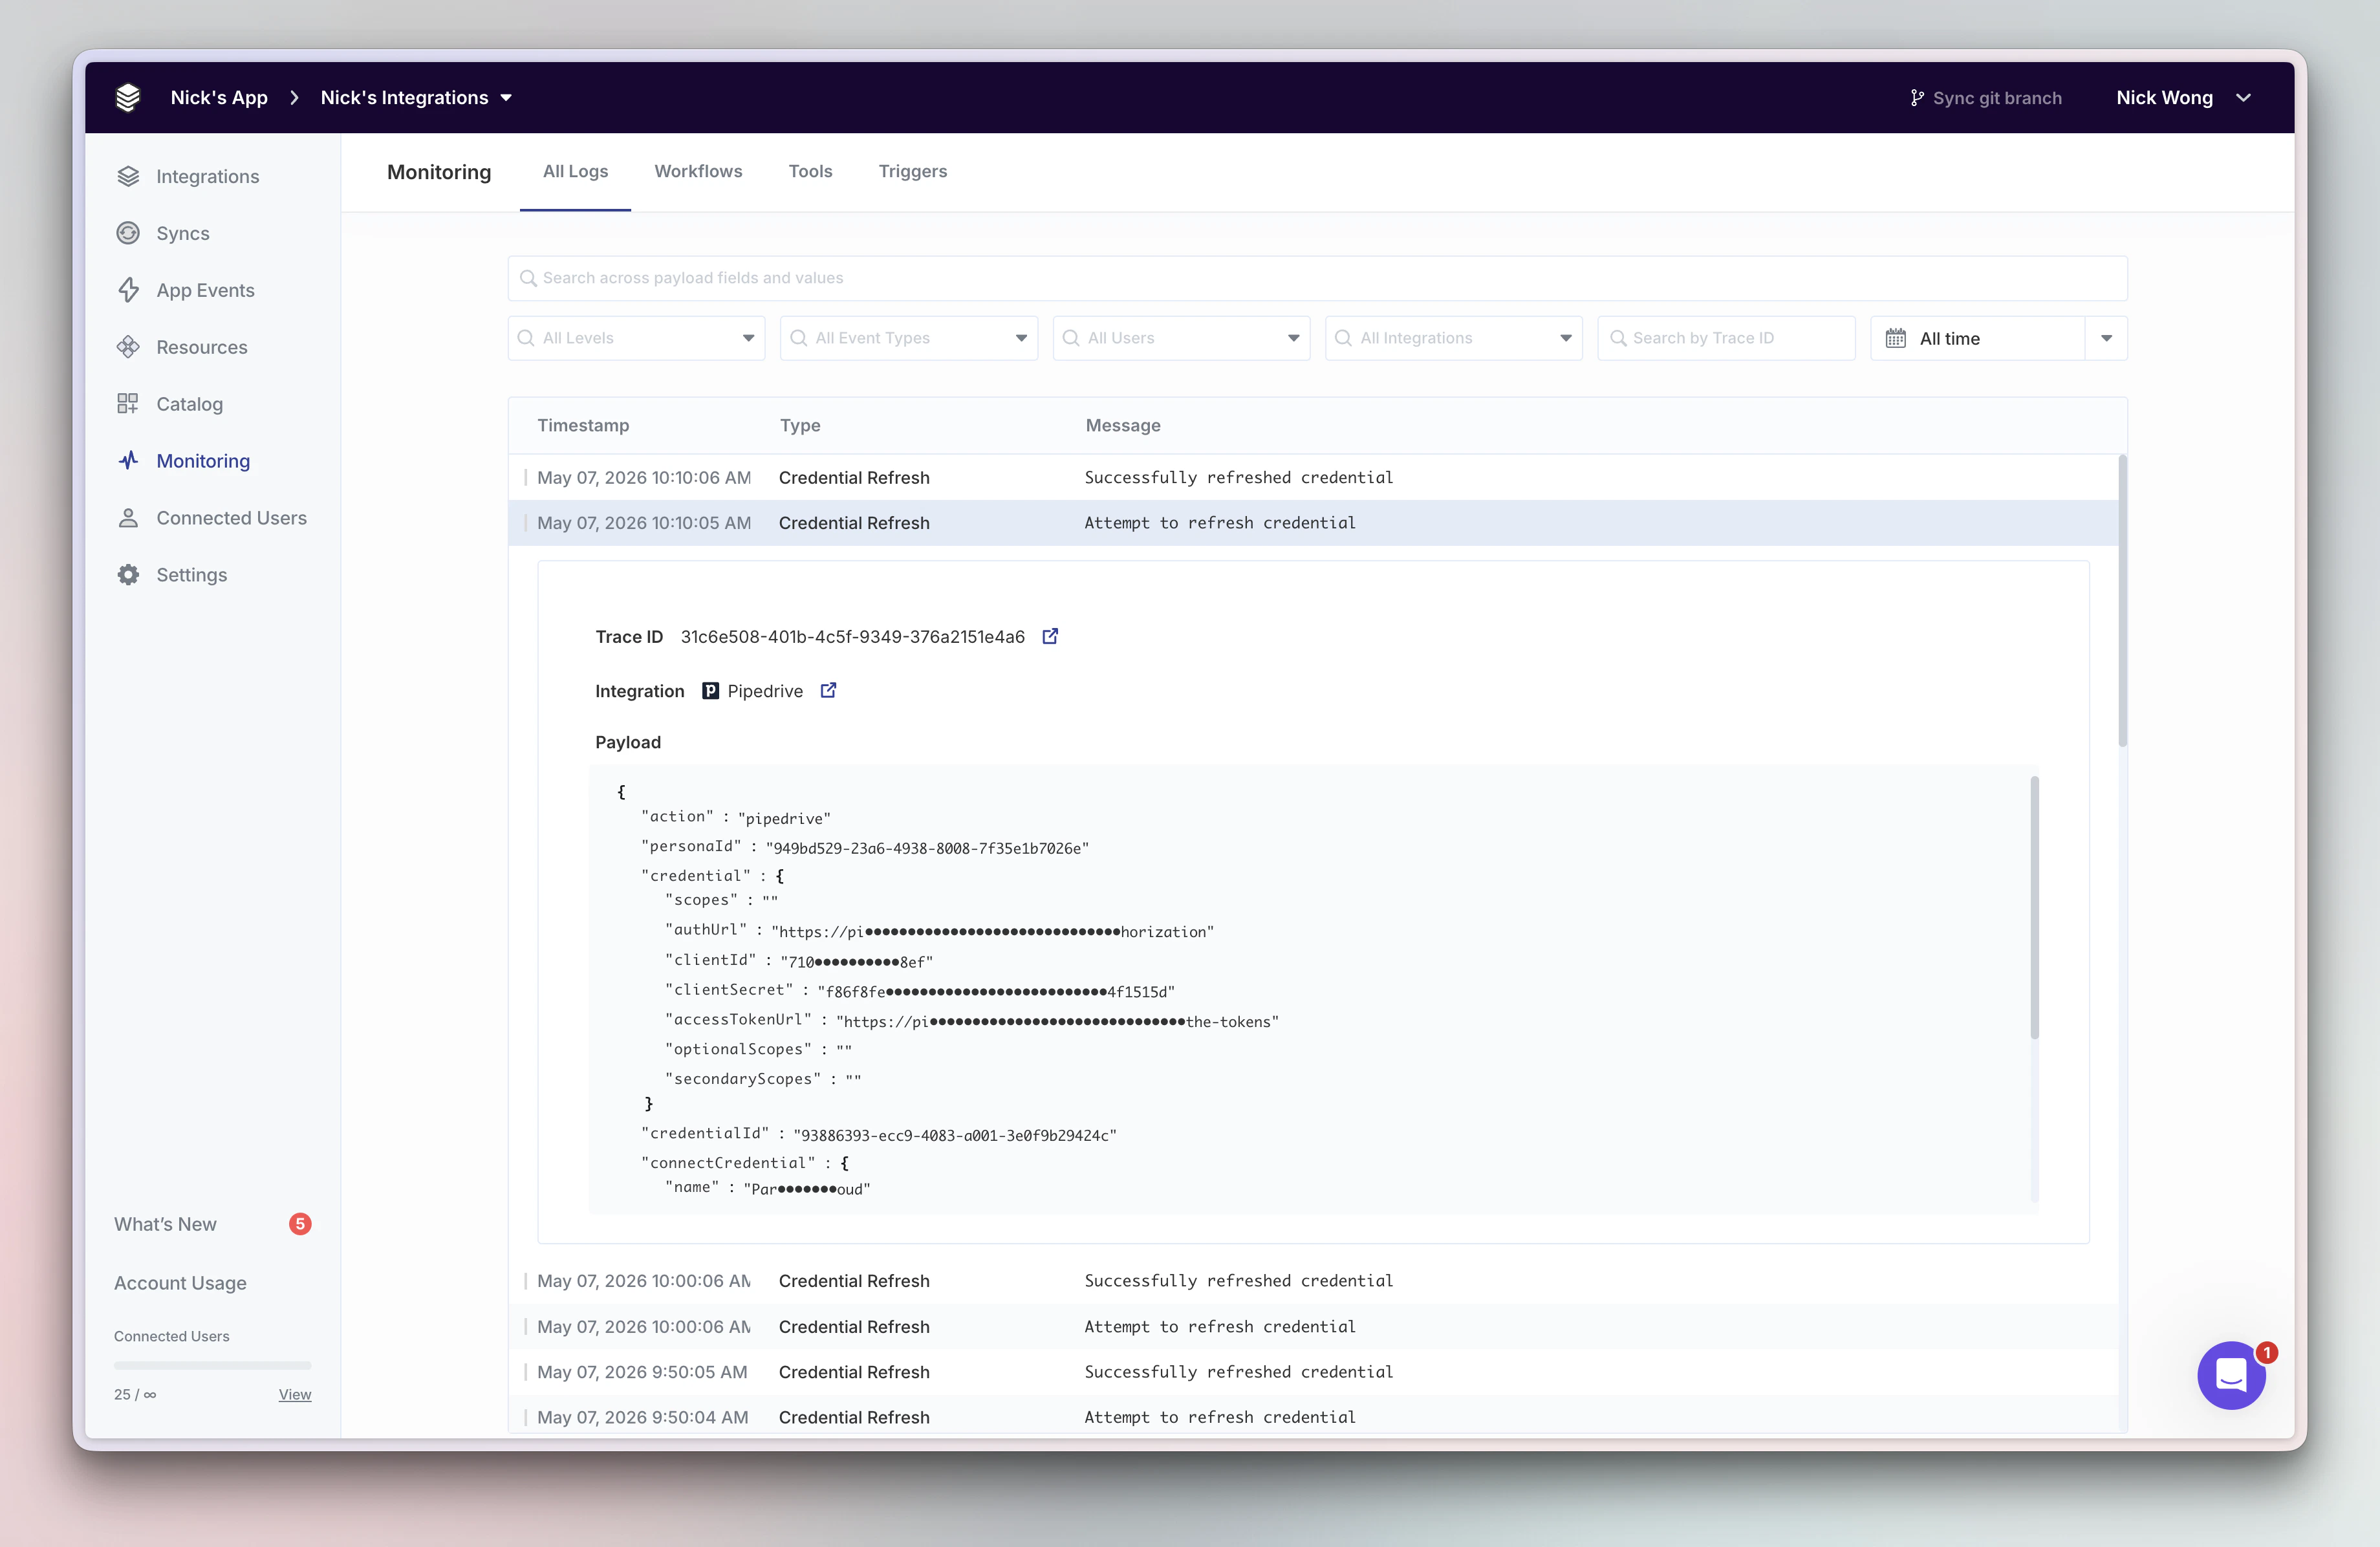
 ## Product-specific Monitoring Views
Products on the Paragon platform each have a dedicated Monitoring view to provide a tailored debugging and observability experience.
Found in the **Monitoring** tab in left sidebar of the dashboard, these views provide a chronological timeline of three main event categories:
* **[All Logs](/monitoring/event-logs)** — Search and filter the atomic logs spanning all events in your Paragon project.
* **[Workflows](/workflows/viewing-workflow-executions)** — Review workflow executions, with step-by-step breakdowns and failure details.
* **[Tools](/actionkit/actionkit-logs)** — Debug and inspect ActionKit tool calls and payloads in real-time.
* **[Triggers](/actionkit/actionkit-logs#trigger-logs)** — Review Triggers API subscription events and payloads in real-time.
## Extend Monitoring to Your Own Observability Stack with APIs
When you need to extend Monitoring to your own observability platforms or get notified in real-time of warnings and errors across your
integration stack, you can use the [Event Destinations](/monitoring/event-destinations) and [Task History API](/apis/task-history).
Learn more about sending warnings to the services your team uses internally like Slack, Datadog, Sentry, and more.
Learn more about querying workflows usage and history using the Task History API.
## Product-specific Monitoring Views
Products on the Paragon platform each have a dedicated Monitoring view to provide a tailored debugging and observability experience.
Found in the **Monitoring** tab in left sidebar of the dashboard, these views provide a chronological timeline of three main event categories:
* **[All Logs](/monitoring/event-logs)** — Search and filter the atomic logs spanning all events in your Paragon project.
* **[Workflows](/workflows/viewing-workflow-executions)** — Review workflow executions, with step-by-step breakdowns and failure details.
* **[Tools](/actionkit/actionkit-logs)** — Debug and inspect ActionKit tool calls and payloads in real-time.
* **[Triggers](/actionkit/actionkit-logs#trigger-logs)** — Review Triggers API subscription events and payloads in real-time.
## Extend Monitoring to Your Own Observability Stack with APIs
When you need to extend Monitoring to your own observability platforms or get notified in real-time of warnings and errors across your
integration stack, you can use the [Event Destinations](/monitoring/event-destinations) and [Task History API](/apis/task-history).
Learn more about sending warnings to the services your team uses internally like Slack, Datadog, Sentry, and more.
Learn more about querying workflows usage and history using the Task History API.